How to create an effective and real time data dashboard within minutes
7 min read
This walkthrough provides instructions on how to make dashboards within a few minutes using Rapidomize . We have a scalable and easy to navigate user interface, which allows you to customize the layout to suit your preferences. Most importantly, dashboards are responsive and allows you real time visibility of your data to take data-driven informed decisions on time.
Use well-rounded and user-friendly Rapid Interfaces and create any kind of dashboard for any industry or purpose, according to your preferences.
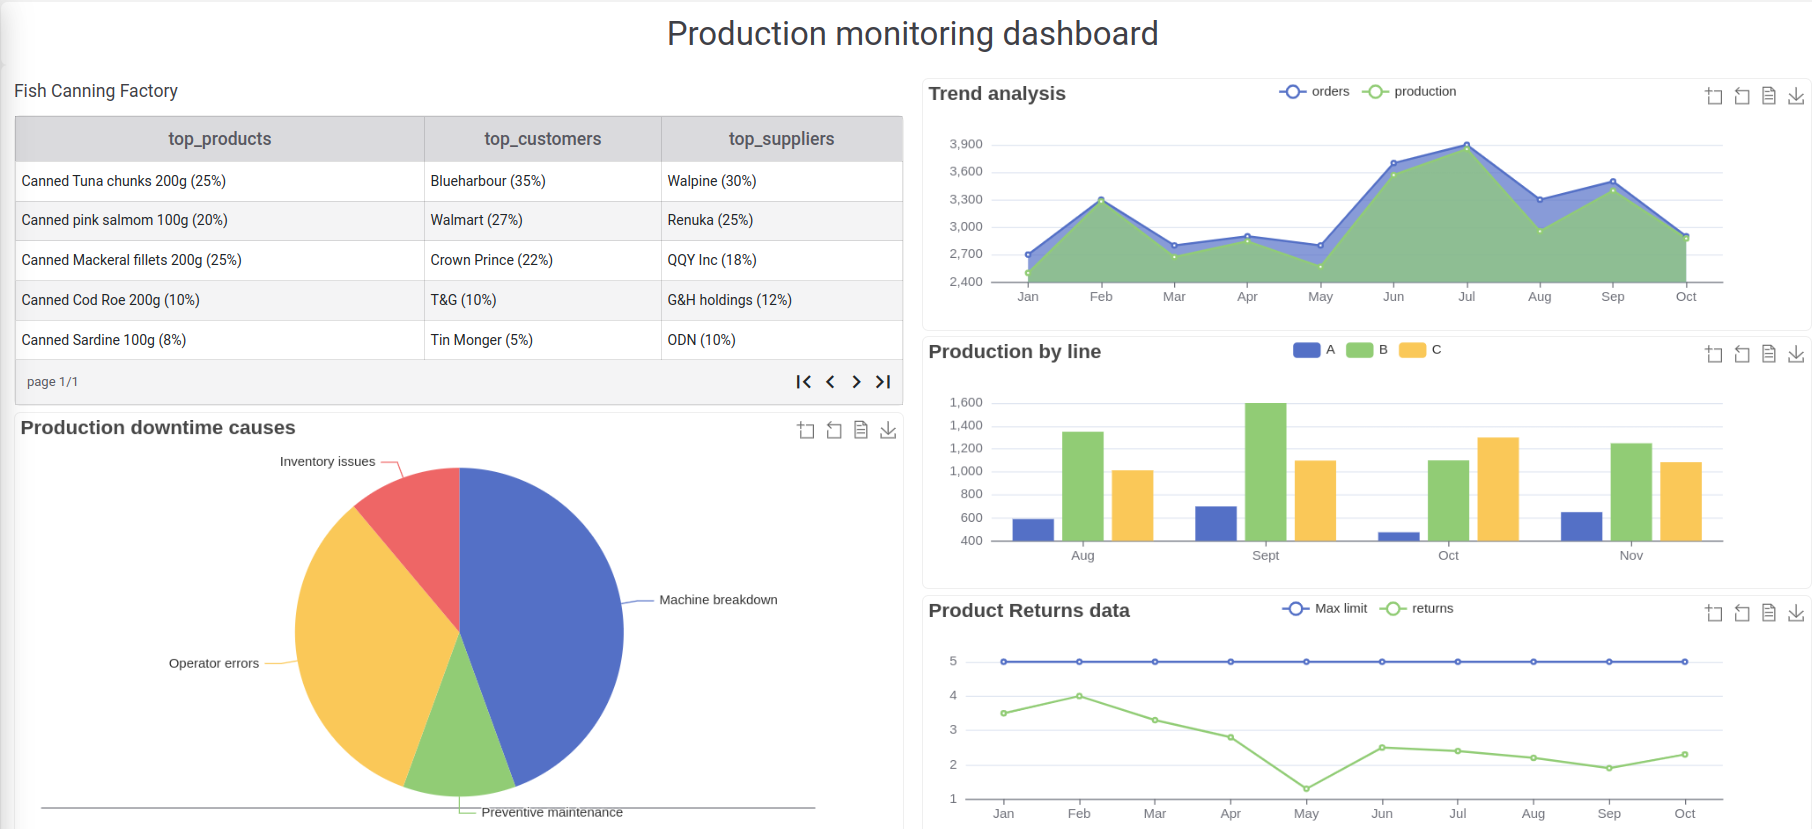
Here, we will be creating a production monitoring dashboard that can be used for manufacturing and industrial settings to monitor operations and performance, while controlling quality and cost. Follow the step by step guidence and start creating any dashboard of your choice using Rapid Interfaces.
Setting up
Note
As a pre requisite, choose an existing project or create a new project before creating your task. Refer How to create a project..-
Click Rapid Interfaces icon
 on the Menu.
 -
Click on the (+) button to start creating a new rapid interface.
-
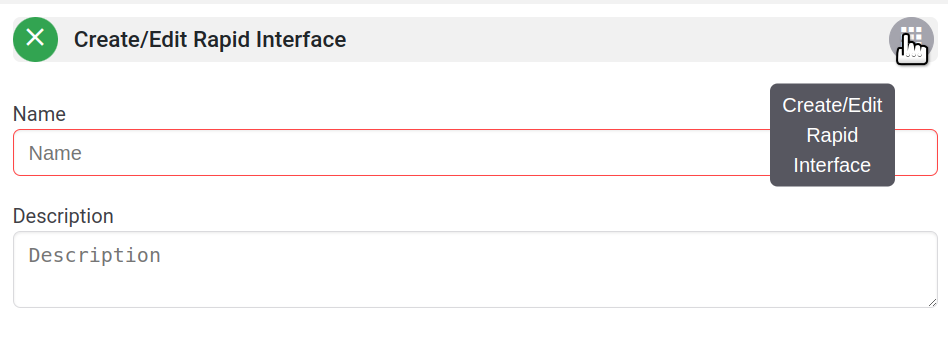
Name your new rapid interface (dashboard).
-
Click create/edit rapid interface button to start creating your dashboard.
-
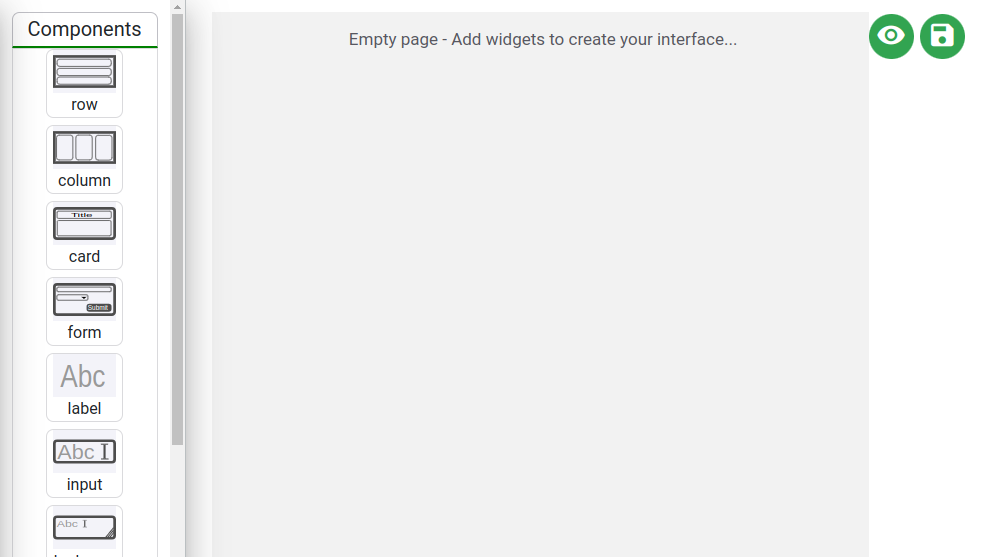
You will be directed to the “Rapid interface editor” where you have all the UI widgets that you need to create your dashboard.
Create the Dashboard layout
-
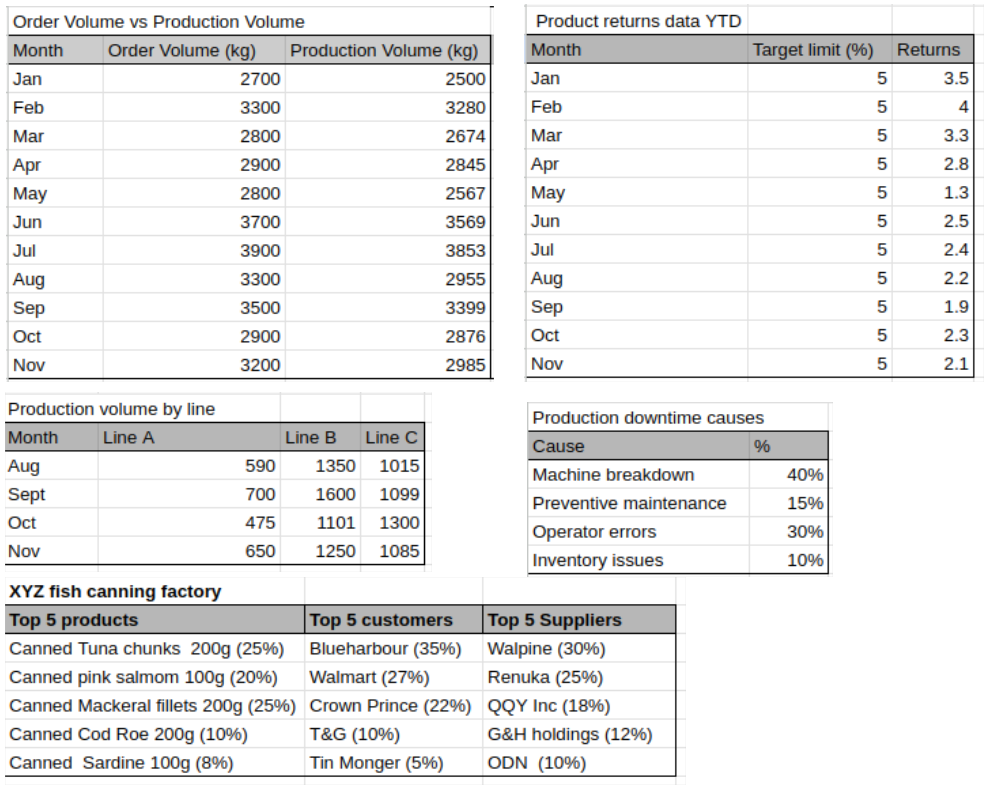
To create a dashboard, you need to source data from either a database or a sheet. Rapidomize allows you to source data from both databases and sheets (Google sheet/excel… etc.). You can collect data by using forms created through Rapid Interfaces for this purpose as well. Since accurate and clear data is the backbone of any great dashboard, make sure that your data are reliable and accurate before building your dashboard. We used following data in a Google Sheet to build this dashboard.
-
All components/widgets needed to create dashboards are available on the left hand side menu of the “rapid interface editor”. To set title & other settings of a widget, click the relevant widget to open the right-hand-side settings panel. In the settings panel, you can see two tabs, “General” and “Styles”. In the “General” tab, you can set the title, data sources, etc. In the “Styles” tab you can set width, height, font size, color etc. of a widget easily.
-
You can use “Rows” and “Columns” (layout widgets) as basic tools to create your layout. Refer https://rapidomize.com/docs/rapps/ for more details on how to use rapid interface components to make different interfaces.
-
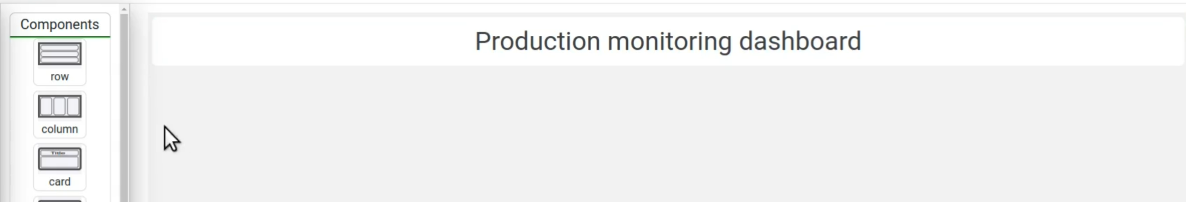
Add a row to the editor (drag and drop). This is for the title of your dashboard.
-
Add a label inside the row and put the title of your dashboard. Click on the label and set the height, font size, color etc. and customize your title. If you want to center your label, set margin to auto.
-
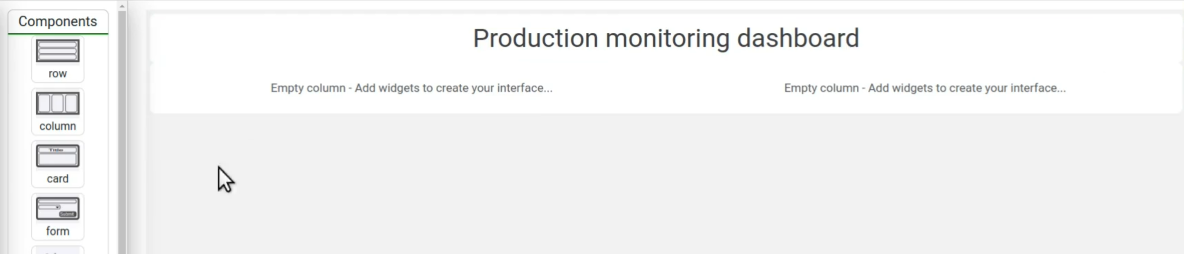
We have one table and four charts in the above dashboard. To set the layout as above, add another row and add two columns in to this row to divide the dashboard space in to two sections (likewise, you can add rows and columns to get the required number of sections for your dashboard). Using the set up widget for each column, set the width to 50%, to get equal areas for each section. Width depends on how the dashboard divides.
-
Add a label to the column on the left (drag and drop Label widget into the column) as the table title.
-
Add a table to the same column and then add two charts below that. Add another two charts to the column on the right hand side.
-
Click on each chart and set up the width as 100% to get the full occupancy for the allocated area.
-
Click on each chart and type the chart title on the title box.
-
Save your dashboard layout (save button at the top right corner) and refresh the page (press F5) if chart area did not change automatically. Now we have accomplished creating the basic layout for this dashboard.
-
Next step is to use a workflow to source data. This can be done in two ways. If you already have an
for this purpose, see Setting up the dashboard components or you can create an at this stage.
Create your workflow
Create an
-
If you want to create a new
(design a new workflow) for this purpose, click on the Intelligent connected Apps (Button) on the left hand side menu and select Create an button. Give a name for your . Instructions on creating is available in https://rapidomize.com/docs/getting-started/ -
For this
, we are going to use a database as our source to get required data for the dashboard. You can also use sheets as your data source like Google Sheets https://rapidomize.com/docs/svc/google-sheets, Microsoft Excel https://rapidomize.com/docs/svc/microsoft-excel etc. -
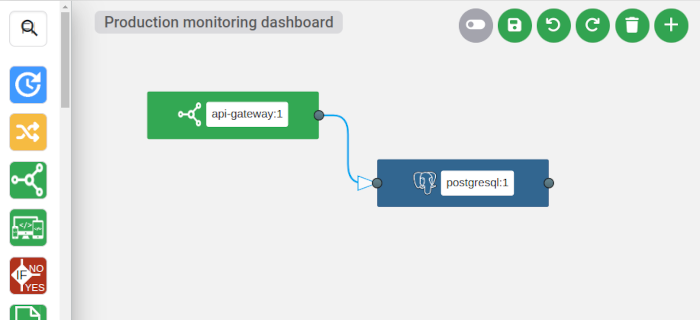
Use API gateway as your trigger App. Drag and drop API gateway to the workflow .
-
Now click on API gateway and select your App/device https://rapidomize.com/docs/svc/api-gateway.
-
Click “Select”.
-
Select “receive API requests” as your trigger.
-
We use PostgreSQL (you can use MySQL, MongoDB, …etc)., as our database here, so, drag and drop it to the workflow worksheet as the action and connect to the trigger.
-
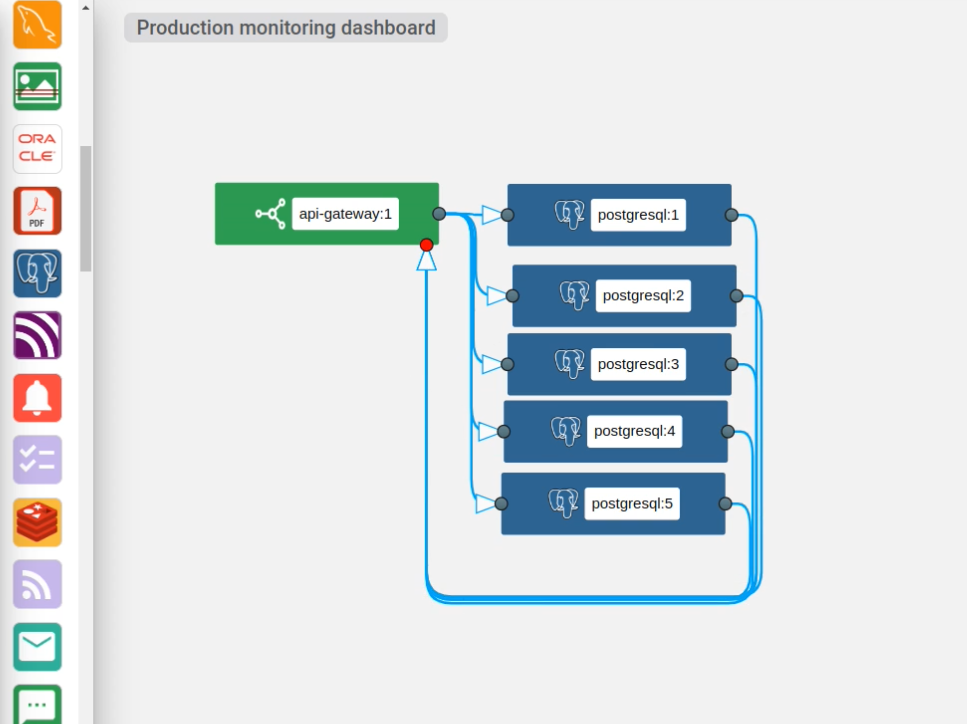
Since we have five widgets in our dashboard (1 table and 4 charts), drag and drop four more PostgreSQL nodes, and connect them to the trigger (API gateway) as follows.
Get data from the database
-
Click on the PostgreSQL node and select default database to source data. If you want to use any other PostgreSQL database than above, select custom database and specify the IP address, port and the name of your database. Then, authorize Rapidomize to access your database.
-
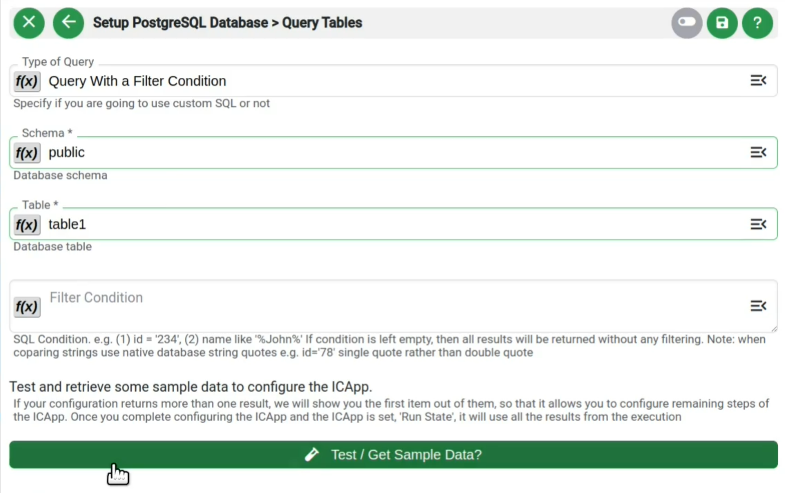
Select Query tables as your action. In the configuration for type of query, select Query With a Filter Condition. Select the database schema, & table. Optionally you can specify a condition for the data filtration. Click “Test” Button to get some sample data.
-
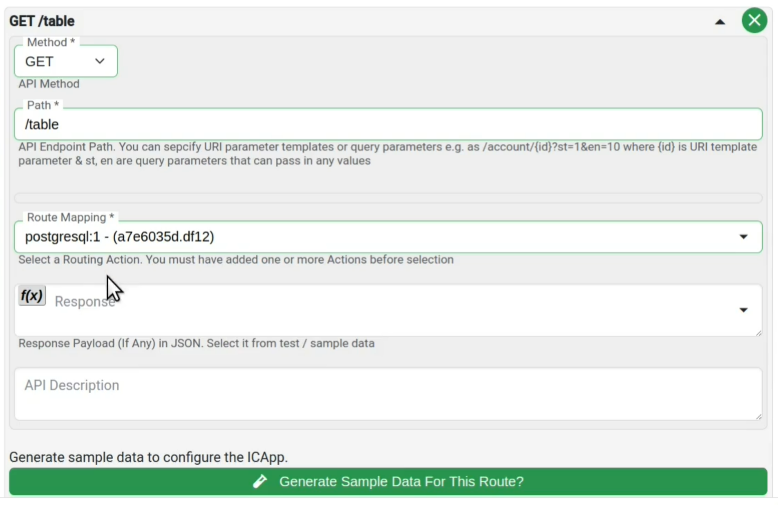
Now, click on the trigger (API gateway) and select “API Routes: 0”. Set the API route method to “GET” to retrieve data from the source. Specify the path to your API endpoint.
-
Select route mapping as PostgreSQL:1.
-
Connect the PostgreSQL node output port to the api-gateway response port. Set response field of the api-gateway by selecting {{#postgresql:1[]}} from your sample data generated for PostgreSQL.
-
Follow the same procedure for all PostgreSQL nodes. Select the relevant macro for each PostgreSQL nodes. Ex: If connecting 2nd PostgreSQL node to api-gateway, set {{#postgresql:2[]}} in the response field in api-gateway.
-
Save and run your
. Now your workflow is ready to be used.
Setting up the dashboard widgets
-
Now go back to your dashboard by clicking Rapid Interfaces icon
on the Menu and selecting the edit icon of your relevant interface. You will be redirected to the rapid interface editor. -
Select create/edit rapid interface button to edit your interface. You will be directed to the layout of your rapid interface.
-
To populate the table, click on the table widget and select the
(from right hand configuration panel) as your data source from the General tab. 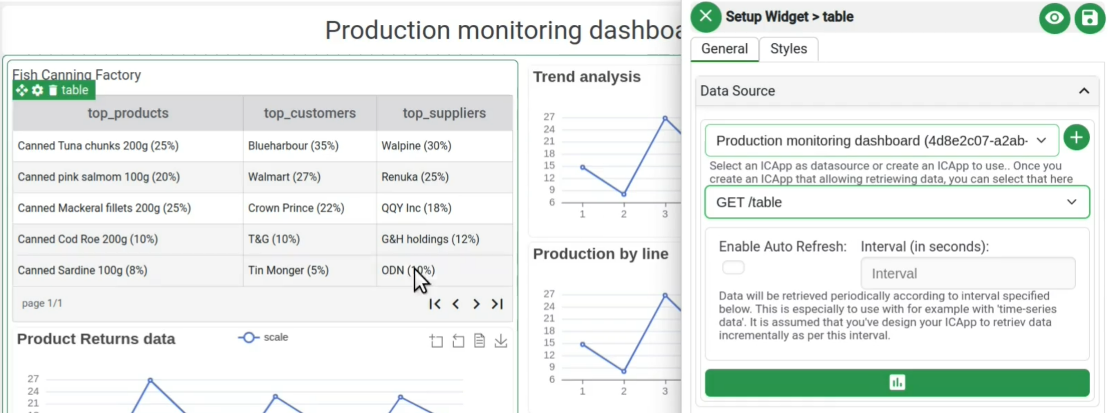
-
To populate the charts, click on each chart and on the set up widget, select chart type from the “chart type and series tab” and the X and Y-axis for the chart.
-
Then type the series labels. If you have more than one series in a chart, click the plus button to add series.
-
Specify the API route you defined in the api-gateway for the Table data. Repeat the same for other charts as well (select relevant API routes).
-
Save the interface by clicking the save button.
-
You can preview your dashboard by clicking the eye icon

-
If you want to re-arrange the widgets, click the “disable preview” button. Do your changes and click “Save”.
-
Click rapid interface icon on the Menu and enable the “Dashboard” checkbox of the interface you created to make it as your current dashboard.
-
You can access your dashboard at any given time by clicking on the rapid interface icon and selecting the particular dashboard card from the list or double clicking on the Dashboard icon